
If you’ve been watching the headlines and wondering whether now is the right time to buy, invest, or hold — the numbers just gave you a clearer answer than you might expect. There’s a particular kind of noise that surrounds property markets at inflection points. Headlines oscillate between “market cools” and “prices soar.” Commentators contradict each other. And buyers — understandably — freeze.
But beneath the noise, two major data releases have just dropped that cut through the confusion in a meaningful way. The ABS Lending Indicators for March 2026 and the Building Approvals data for April 2026 tell a story that the headlines are largely missing. And if you’re considering property — whether as a home, an investment, or a long-term wealth vehicle — this story is one you need to understand.
Read more“Lending Fell” in Property Is Not the Story You Think It Is
Yes, new home loans dipped in the March quarter. Quarter-on-quarter, total dwelling loans fell 6.2%. That’s the number that made the news cycle.
Here’s what didn’t.
Year-on-year, total loan values rose 18.5%. Investor loan numbers climbed 18.8%. Investor loan values surged 25.3%. First-home buyer values were up 17.9%.
Think about what that means. The market is materially stronger than it was twelve months ago — by almost every meaningful measure. What we’re seeing isn’t a downturn. It’s a pause. And pauses in strong markets are historically where the most intelligent buying happens.
So why did lending dip quarter-on-quarter? The evidence points to buyers sitting on their hands — waiting for further RBA rate cuts, digesting the post-election landscape, or holding out for improved borrowing capacity. Demand hasn’t gone away. It’s been temporarily deferred. And deferred demand, in an undersupplied market, is pressure building behind a door.
The Property Signal Most Investors Are Missing
When sophisticated investors and institutions are still actively committing capital, that’s a leading indicator that deserves attention. Right now, that signal is flashing.
Across Australia in March 2026, investors drew down $41.5 billion in property loans — across 57,342 individual loans. That’s not speculative froth. That’s coordinated, considered capital deployment at scale.
Why does this matter to you? Because institutional and experienced investors do their homework. They’re not chasing headlines — they’re reading vacancy rates, rental yields, population flows, and replacement costs. The fact that they’re still moving aggressively into this market, at these price levels, says something important about where they believe the market is going.
The other telling data point: average loan sizes are rising. The average owner-occupier loan in Australia climbed from $660,000 in March 2025 to $735,000 in March 2026 — an 11% increase in a single year. In NSW, the average now sits at $860,000. In Queensland, it jumped 15.6% to $741,000.
People don’t borrow more if they expect prices to fall. They borrow more when they expect their asset to appreciate.
Why Property Supply Is Your Most Important Number Right Now
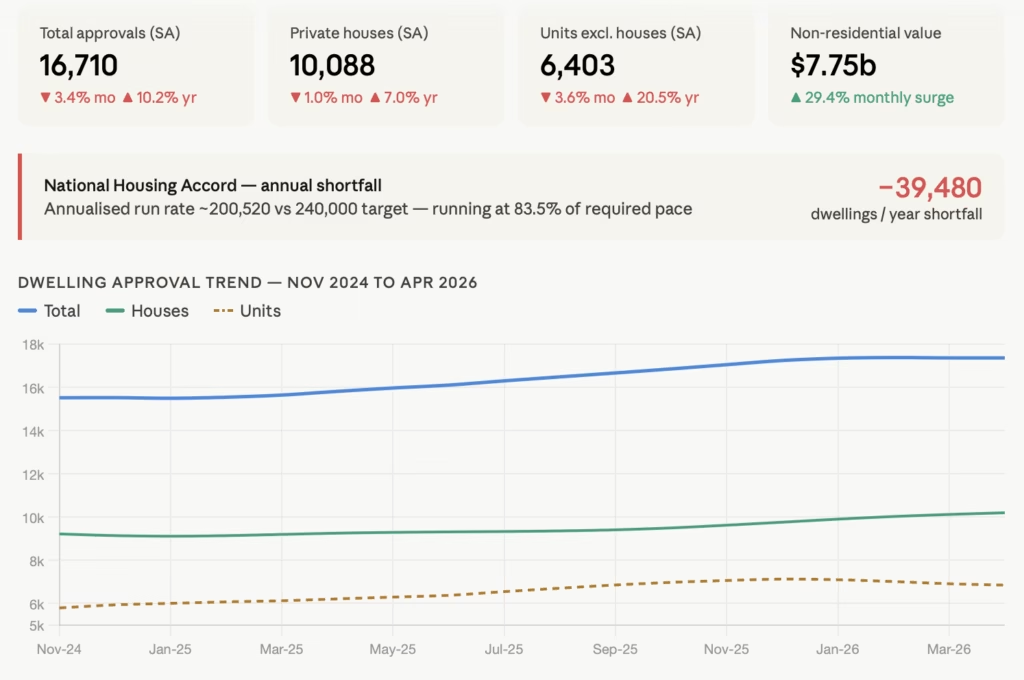
Here’s the structural reality that underpins everything else: Australia is not building enough homes.
April’s building approvals data puts the annual run-rate at roughly 200,500 new dwellings. The National Housing Accord target is 240,000 per year. That’s a shortfall of approximately 40,000 homes annually — and that gap is happening against a backdrop of net overseas migration still running above 400,000 people per year.
The maths is unforgiving. When demand persistently outpaces supply, prices don’t fall. They find a floor, consolidate, and move higher.
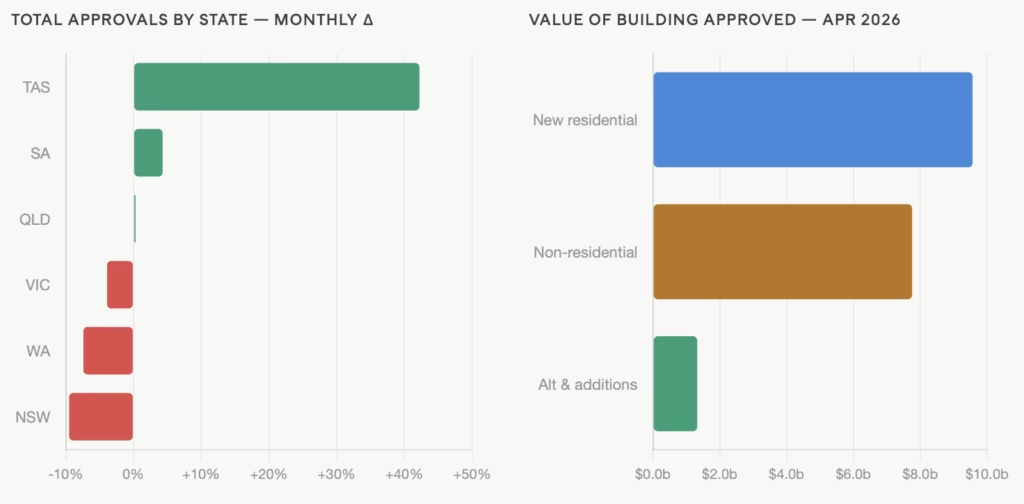
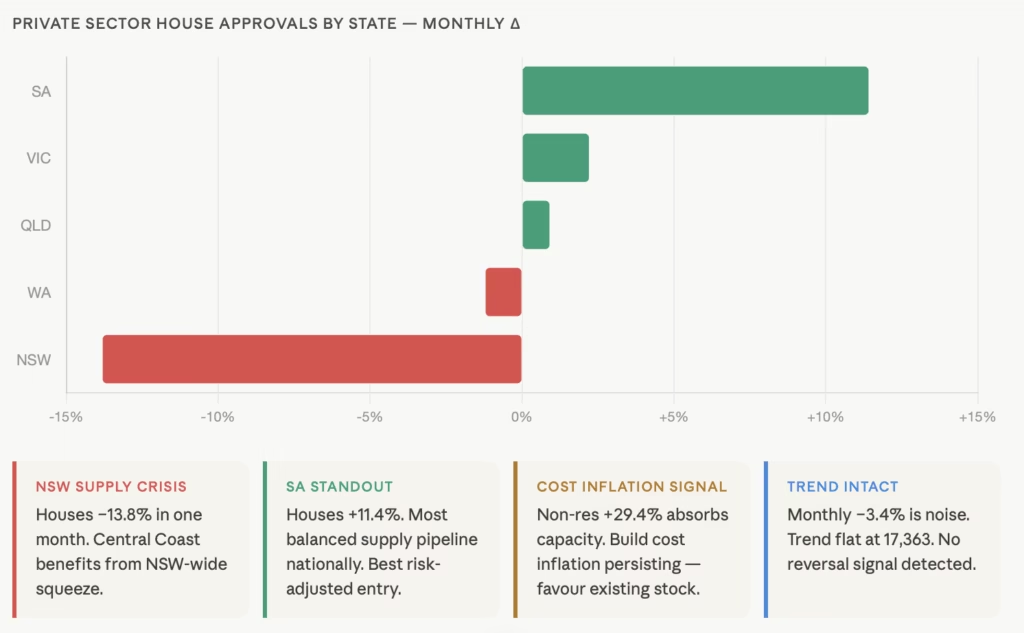
Across the country, this undersupply story is playing out at different speeds in different states — and that’s where the nuance matters for buyers and investors. NSW, in particular, is alarming. House approvals in NSW collapsed 13.8% in a single month in April. For context: NSW is the most populous state, carries the most chronic supply pressure, and is approving the fewest new homes relative to its demand base.
Fewer approvals today means fewer completions in 18 to 24 months. That’s a mathematical certainty. And what it does to rents and prices in markets like the Central Coast — which sits squarely in Sydney’s overflow corridor — is not hard to model.
The Queensland Opportunity Is No Longer a Secret
Queensland deserves special attention.
The average investor loan in Queensland jumped from $624,000 to $711,000 year-on-year — up 13.9%. Owner-occupier loan sizes rose 15.6%. These are among the fastest growth rates nationally.
The drivers are structural, not speculative: interstate migration continues to outpace expectation, affordability relative to Sydney remains compelling, infrastructure spending is accelerating, and the Olympics investment pipeline is only just beginning to flow through.
Markets driven by population growth, infrastructure uplift, and rental shortage don’t resolve quickly. They compound.

The Construction Finance Number That Changes Everything
Perhaps the most underreported figure in the entire data set: business lending for construction rose 58.1% year-on-yearto $12.2 billion in March 2026.
That is an extraordinary number.
Developers and builders are not optimists by nature — they are practitioners of hard financial discipline. They do not commit billions of dollars to new projects unless the numbers work, demand is real, and future absorption is credible. A 58% surge in construction finance tells us the development community believes firmly in the demand story ahead.
It also tells us something else: construction labour and materials are being absorbed at pace. That means build costs are not coming down. Which means existing stock — already built, in well-located areas, ready to move into — carries an increasing replacement cost premium. The gap between what something would cost to build and what you can buy it for is a margin of safety that buyers often underestimate.
What the Smart Money Is Actually Doing
Put these data sets together and a coherent picture emerges:
- Investors are committing at record loan values, despite a quarterly pause in volumes
- Average loan sizes are growing — borrowers expect appreciation, not depreciation
- Supply is structurally constrained, particularly in NSW and increasingly in WA
- Queensland is in an accelerating growth phase underpinned by real fundamentals
- Developers are deploying billions into future supply — signalling conviction about demand
- Refinancing activity is elevated, suggesting sophisticated borrowers are repositioning for the next cycle
This is not a market in distress. This is a market in preparation.
What It Means If You’re Sitting on the Fence
One of the most expensive decisions in property isn’t the wrong purchase — it’s the delayed purchase. Markets that are pausing in the face of strong underlying fundamentals tend not to pause indefinitely.
The combination of rate cut expectations, pent-up buyer demand, a structural supply deficit, and strong investor conviction creates conditions where the current window of relative calm may be shorter than it feels.
That said, not every market and not every asset class performs equally through these cycles. The state divergence in the building approvals data alone tells you that where you buy matters enormously. The loan size data tells you that product mix and location within a market matters too.
Understanding which markets are genuinely undersupplied, which assets carry replacement cost premiums, and whichlocations sit in structural migration corridors — that’s the work that separates investors who compound wealth from those who simply follow the market.
The data is clear. The question is whether you know how to read it for your specific situation — and act before the pause becomes a surge.
If you’d like to understand what these numbers mean for your investment strategy or buying decision, get in touch. A conversation costs nothing. Waiting, in this market, often does.
show less