
Australia’s property market has not always offered a clean verdict. But in 2026, it is giving us something rarer still, a market that is simultaneously booming and correcting, depending entirely on where you look and who you are.
Rate hikes, oil shocks, and a forecast reshuffle have created the most divergent property landscape in a decade. Here is what first home buyers, long-term investors, and fence-sitters each need to understand — and do — right now.
SQM Research’s revised forecasts, released in early 2026, sent ripples through the property conversation. The headline figures were stark: Sydney tipped to fall by as much as 6%, Melbourne by up to 4%, while Perth and Darwin are expected to surge into double-digit growth territory. The national weighted average? A modest 0 to 3% — well below the historical norm of 7.8%.
But numbers stripped of context are just noise. What matters is how you read this map, and more importantly, how you use it based on where you stand in your property journey.
Read moreWhy Australia’s Property Forecasts Were Downgraded
Two forces collide at the heart of this revision. The first is the oil crisis and its inflationary ripple effect across the broader economy. As energy costs rise, the cost of living rises, and the RBA has little choice but to respond with the blunt instrument of interest rate hikes. The second force is the rate cycle itself.
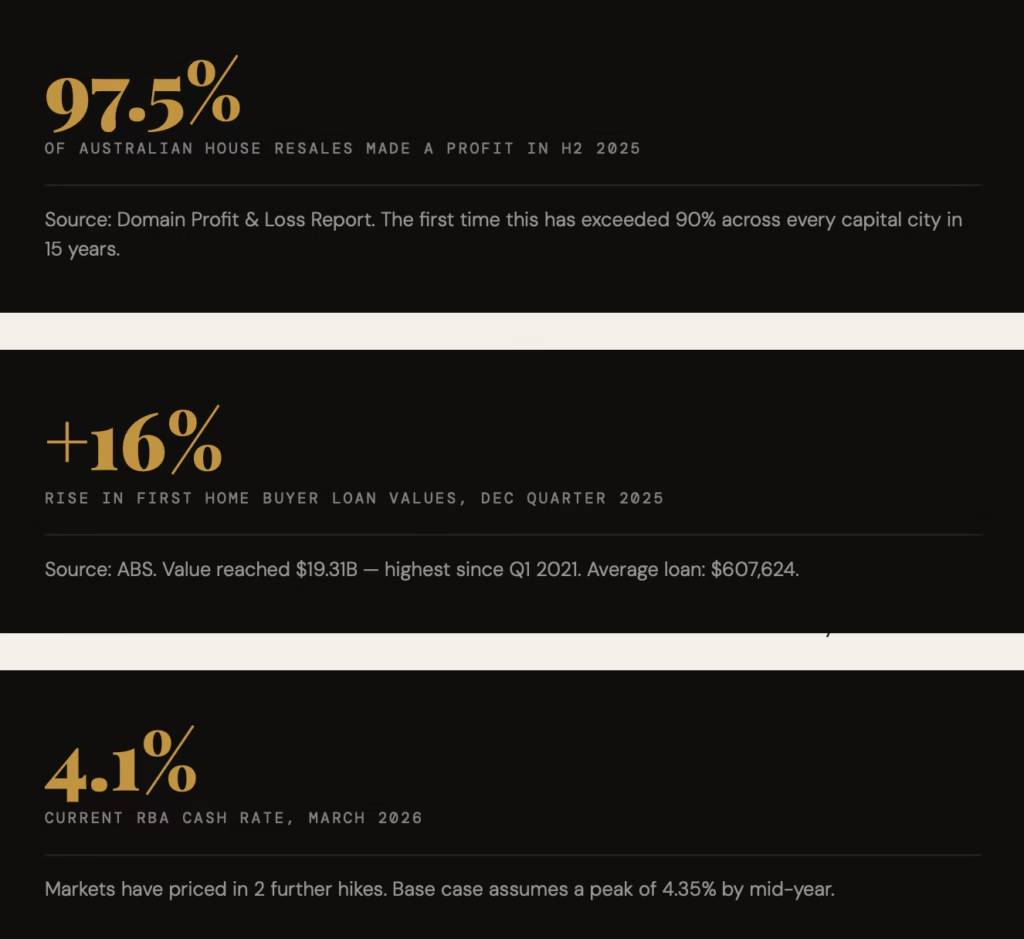
The RBA raised the cash rate to 4.1% in March 2026 — its second successive hike this year — and futures markets have fully priced in at least two more increases, with a third possible by year end. If the oil situation escalates further, annual inflation could peak between 4.4% and 5% in the June quarter, a scenario SQM has now built into its base case.
This is not the worst-case scenario — that is reserved for the aggressive rate path, where the cash rate rises above 4.5% and inflation breaches 5.5%. Even in that scenario, however, Perth is still forecast to grow at 6 to 10%, which says something important about the structural nature of certain markets.
Sydney and Melbourne are the most price-elastic markets in Australia. When rates rise, they feel it first. When rates fall, they recover fastest. Understanding this is not pessimism — it is strategic timing.
SQM RESEARCH, MARCH 2026 REVISED OUTLOOK
Australia’s City-by-City Reality
The revised forecasts break sharply along geographic lines. This is not a national story — it is six or seven separate stories happening simultaneously.
| CITY / REGION | FORECAST RANGE (2026) | DIRECTION | KEY DRIVER |
|---|---|---|---|
| Perth | +10% to +13% | ↑ Strong | Resources boom, population growth |
| Darwin | +12% to +16% | ↑ Very Strong | Resources, defence investment |
| Adelaide | +7% to +11% | ↑ Strong | Affordability, interstate migration |
| Brisbane | +7% to +11% | ↑ Solid | Olympics infrastructure, lifestyle shift |
| Sunshine Coast | +6% to +10% | ↑ Solid | Lifestyle premium, infrastructure |
| Gold Coast | +4% to +7% | → Moderate | Tourism, interstate demand |
| Hobart | +3% to +6% | → Moderate | Stabilisation after corrections |
| Sydney | −6% to −2% | ↓ Declining | Rate sensitivity, affordability ceiling |
| Melbourne | −4% to −1% | ↓ Declining | Oversupply risk, financial sector exposure |
It is worth noting that SQM’s view is not universally shared. KPMG’s independent modelling still projects national gains of around 7.7% for 2026, based on a less aggressive rate path. The divergence between forecasters is itself a signal: this market contains genuine uncertainty, and anyone presenting a single, confident number deserves scrutiny.
If You Are a First Home Buyer
WHAT THE DATA ACTUALLY SAYS
Here is the statistic that cuts through the headlines: the number of first home buyer loans issued in the December 2025 quarter was the highest since 2021 — a nearly five-year high. The value of those loans rose 15.5% in a single quarter, with the average first home buyer now borrowing $607,624.
This is partly driven by the federal government’s 5% deposit scheme, which has meaningfully lowered the entry barrier. More Australians are getting into the market despite higher rates than at any point in the last several years.
That is the optimistic reading. But the full picture demands you hold the other side of this coin with equal seriousness.
THE RISK NO ONE IS TALKING ABOUT
Buying with a 5% deposit — particularly in Sydney or Melbourne — means you carry a paper-thin equity buffer entering a market that is forecast to fall. A 5% price correction in Sydney wipes out the entirety of your deposit in nominal terms before you’ve made a single extra repayment. This is not a reason to never buy. It is a reason to choose where you buy with extreme care.
If you are a first home buyer with a 5% deposit, the most important decision you will make is not when you buy — it is where. Entering a market forecast for 8–10% growth gives your 5% deposit immediate leverage. Entering a market forecast for a 5% decline means your equity is negative within twelve months.
ACTION FRAMEWORK: FIRST HOME BUYERS
- Avoid markets with flat or negative forecasts if using a minimal deposit — the margin for error is zero
- Adelaide, Brisbane outer suburbs, and select Perth corridors offer the strongest affordability-to-growth ratio for entry-level buyers
- Use the government scheme as access, not as a green light to overborrow — stress-test your repayments at 5.5% cash rate
- Understand that 97.5% of house resales nationally made a profit in 2025 — long holding periods are the single most reliable protection strategy
- If your target city is Sydney or Melbourne, consider waiting for Q3 2026 — the correction window may present a better entry point with more equity headroom
- Learn how to protect your interests, manage risks, and secure better assets
If You Are a Long-Term Investor
WHY DIVERGENCE IS YOUR GREATEST ALLY
The fundamental shift this market requires of investors is a move away from brand loyalty — loyalty to city names, postcode prestige, or the idea of “blue chip” as a fixed address — toward understanding cycle timing. A blue chip suburb in a city entering a rate-driven correction is not a sound investment in 2026. A regional market in a structurally undersupplied city is.
Domain’s Profit and Loss Report for the second half of 2025 underlines the long-game principle beautifully: 97.5% of house resales nationally returned a profit. In Brisbane and Perth, that figure hit 99.5%. Median profits in Sydney reached $750,000 per transaction — because homeowners stayed put through multiple cycles and let compounding do its work.
The data validates a portfolio approach built on geographic diversification. Owning six properties across six different markets, each at a different point in its cycle, reduces your exposure to any single rate environment. A market rising 10–12% offsets one that is flat. A property in a resources-driven economy hedges against a financial-services downturn in Sydney.
The investor who waits for a perfect market in a single city will lose more time than the investor who deploys capital across imperfect markets in multiple cities.DOMAIN PROFIT & LOSS REPORT, SECOND HALF 2025
THE BORROWING CAPACITY TRAP
One of the most underappreciated risks in rising rate environments is not falling prices — it is falling borrowing capacity outpaced by rising prices. A buyer priced at $500,000 with today’s borrowing capacity who waits for a correction may find that, when rates eventually fall and capacity rises, prices have already moved faster than they could have saved. This cycle has already claimed a generation of would-be buyers who watched their target properties move from $400,000 to $700,000 while their borrowing ceiling held flat or contracted.
The investor’s strategic imperative, therefore, is to deploy available capacity now — but into markets with momentum — and then use that equity growth to access the second purchase in a market currently at its cycle low. The sequence matters enormously.
ACTION FRAMEWORK: LONG-TERM INVESTORS
- Prioritise Perth, Adelaide and Brisbane for equity-generation in the next 12–18 months — use that equity to unlock your second purchase
- Consider Melbourne as a contrarian medium-term play (3–5 year horizon) — corrections in elastic markets historically precede sharp recoveries
- Darwin and defence-corridor properties are an underappreciated hedge against resource cycle tailwinds
- Review your portfolio’s exposure to units — 12% of unit resales are still transacting at a loss nationally. Houses continue to significantly outperform
- Monitor the unemployment rate closely — a material rise is the trigger for rate cuts, which historically re-ignite Sydney and Melbourne fastest
If You Are on the Fence
THE COST OF WAITING IS NON-LINEAR
Fence-sitters tend to frame their hesitation as prudence. In certain market conditions, it is. In this one, the calculus is more complex — and the cost of inaction varies enormously depending on which city you are watching from.
If you are watching Sydney, waiting has a defensible logic. A market forecast to decline 2–6% this year may present better value in late 2026 than it does now, particularly if your deposit is growing faster than prices are falling. But if you are watching Perth or Adelaide, the same logic works against you — every quarter you wait is potentially 2–3% of price growth you are not capturing, and 2–3% of equity you are not building.
The hardest truth for fence-sitters is this: you are not waiting for the right time to buy. You are waiting for the right city at the right time to align. Those are two different decisions, and conflating them is the most common reason buyers remain on the sidelines five years longer than they needed to.
ACTION FRAMEWORK: FENCE-SITTERS
- Define your strategy before you define your market — without clarity on your 5-year goal, no amount of market data will move you off the fence
- If your deposit is under 10%, get pre-approval now — understanding your actual borrowing capacity changes the entire decision framework
- Do not wait for a national correction — corrections are city-specific. Perth is unlikely to correct. Sydney already is
- Assess your rent-versus-buy equation city by city — in Perth, buying almost always wins now. In Sydney, the maths are tighter in 2026
- The next RBA decision and Q2 inflation print are the two data points that will clarify the second half of 2026 — build those into your timeline
Australia’s Three Scenarios You Need to Know
SQM Research frames 2026 across three distinct scenarios, each with meaningfully different outcomes. Understanding which scenario is playing out — in real time — is the most valuable skill any buyer or investor can develop this year.
Base Case (most likely): Cash rate rises to 4.35% by mid-2026. Inflation peaks between 4.4–5%. National growth lands at 0–3%. Sydney and Melbourne drift down while Perth and resource markets continue to outperform. This is the scenario to plan for.
Scenario Two — Aggressive hikes: Cash rate rises above 4.5%, inflation exceeds 5.5%. Sydney and Melbourne fall harder. Remarkably, Perth still grows 6–10% even in this case — a reminder that structural demand in certain markets transcends the rate cycle.
Scenario Three — Hike then cut: The RBA raises once more but is forced to cut in Q4 2026, triggered by rising unemployment or a collapse in economic demand. This scenario is the best outcome for diversified investors — it compresses the downside window in Sydney and Melbourne while providing a recovery springboard.
No single scenario is guaranteed. What is guaranteed is that the national average will mask enormous local variation, and that your outcomes as a buyer or investor will depend far more on your city selection and entry timing than on any macroeconomic headline.
The Bottom Line
Australia’s property market in 2026 rewards those who stop thinking in national averages and start thinking in cycle stages. The data is clearer than it has been in years — it is simply pointing in multiple directions at once. Perth is mid-cycle momentum. Sydney is late-cycle correction. Melbourne is capitulation into recovery. Adelaide and Brisbane are early-to-mid cycle with structural tailwinds.
For first home buyers, the priority is protecting your deposit from a negative equity scenario by choosing entry markets carefully. For long-term investors, the priority is deploying available capacity into growth markets now, then diversifying into recovery markets before the next rate-cut cycle compresses the window. For fence-sitters, the priority is simple: make a decision. The market, as it has always done, rewards action over analysis paralysis.
One final figure to carry with you: 97.5% of Australian house resales delivered a profit in the second half of 2025. Not because property never falls. But because the people who sold profitably bought and held. Time, more than timing, remains the most reliable generator of wealth this country has ever produced.
Not sure what this market means for your situation? Book a free 30-minute strategy call, and we’ll map out exactly which market suits your goals, deposit, and timeline — no obligation, no jargon.
DISCLAIMER
This article is for educational and informational purposes only. It does not constitute financial, investment or legal advice. All forecasts cited are sourced from third-party research providers (SQM Research, Domain, ABS, RBA) and carry inherent uncertainty. Please consult a licensed financial adviser before making any property investment decisions.
show less