
The Melbourne property market is often discussed as if it moves in a single direction. Headlines tend to simplify the narrative: “Melbourne prices rising” or “Melbourne market cooling.”
But the reality is far more complex.
A closer look at recent suburb-level data reveals something far more interesting happening beneath the surface. Instead of a single market trend, Melbourne is currently experiencing a shift in momentum across different parts of the city. Some areas are seeing strong short-term growth, others are stabilising, and a few are experiencing temporary declines.
For buyers and investors, understanding this shift is critical.
Read moreMelbourne Market Moving in Different Directions
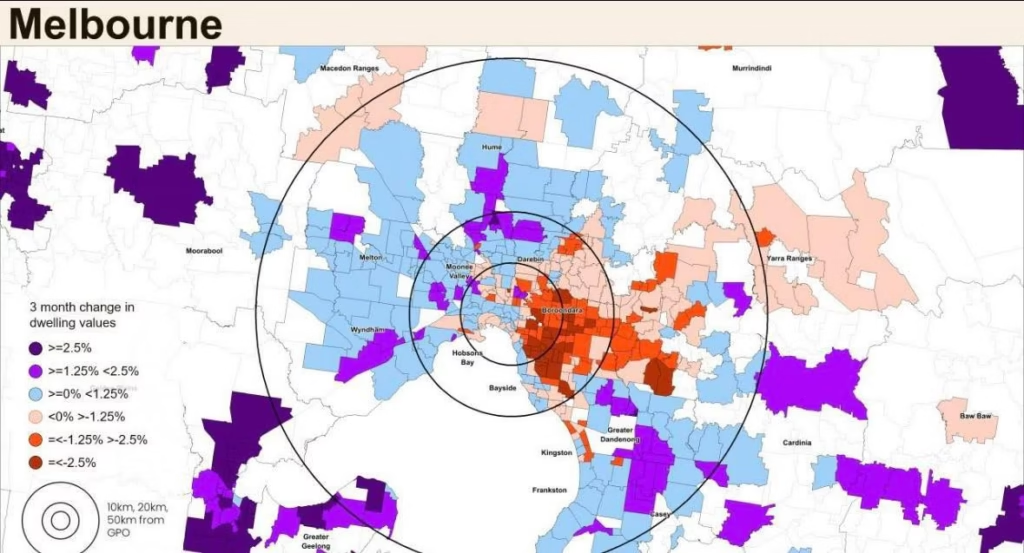
The map above highlights three-month changes in dwelling values across Melbourne suburbs. Each colour represents whether property prices have risen, stabilised, or declined during the most recent quarter.
What becomes immediately clear is that Melbourne is not behaving like one unified market. Instead, it’s showing signs of capital rotating across different locations and price brackets.
This kind of movement is actually common during transitional stages of a property cycle.
While some suburbs are cooling slightly after strong growth in previous years, others are beginning to see renewed demand driven by affordability and buyer migration within the city.
Melbourne Inner Suburbs Experiencing Short-Term Cooling
A noticeable pattern on the map is the concentration of recent price softening across some inner and middle-ring suburbs.
These areas have historically performed strongly and often sit in higher price brackets. When borrowing capacity tightens due to interest rates or economic conditions, these locations can temporarily see reduced buyer activity.
However, it’s important to view this in context.
Markets that have experienced strong long-term performance occasionally go through periods of consolidation. This doesn’t necessarily signal structural weakness; rather, it often reflects buyers adjusting to changing lending conditions.
In many cases, these types of phases can eventually present opportunities for strategic buyers who understand market cycles.

Melbourne Outer Suburbs Showing Renewed Momentum
At the same time, the map highlights stronger short-term growth in several outer suburban corridors.
These areas typically sit within more affordable price ranges, which makes them attractive to first-home buyers and investors when borrowing capacity is constrained.
Demand in these locations is often supported by factors such as:
- Population growth
- Housing affordability
- Infrastructure development
- New community expansion
As migration into Melbourne continues and housing demand increases, more buyers are exploring areas that offer better value within their borrowing capacity.
This trend is contributing to the momentum seen in some of Melbourne’s outer growth regions.
The Middle Ring: A Market in Transition
Between the inner suburbs and the outer growth corridors lies Melbourne’s middle-ring suburbs, and this is where the map shows the most mixed results.
Some locations are recording modest growth, others appear stable, while a few have experienced minor declines.
This type of pattern often appears during market transition periods, when buyers are adjusting their preferences and affordability constraints.
For strategic investors, these areas can sometimes become important to watch because they sit between high-demand premium suburbs and rapidly expanding outer corridors.

Why This Matters for Buyers and Investors
One of the most important lessons from this data is that property markets rarely move uniformly.
Instead, they shift in stages.
Demand flows toward different areas depending on affordability, economic conditions, infrastructure, and population movement. What appears to be a slowing market in one suburb may coincide with strong growth in another just a few kilometres away.
For buyers, this highlights the importance of looking beyond headlines and understanding the underlying dynamics of the market.
Short-term movements can provide useful signals, but successful property decisions usually come from analysing broader trends such as long-term demand drivers, supply constraints, and strategic location selection.
A Reminder About Market Cycles
Another important takeaway is that short-term price movements do not always reflect long-term performance.
A three-month snapshot can show momentum shifts, but property markets typically move through multi-year cycles influenced by factors such as interest rates, population growth, infrastructure investment, and housing supply.
Understanding where different suburbs sit within that cycle can make a significant difference when evaluating opportunities.
The Key Insight
What the map ultimately highlights is this:
Melbourne’s property market is not simply rising or falling. It is evolving.
Different parts of the city are responding differently to current economic conditions. Some areas are consolidating after strong growth, others are stabilising, and several locations are seeing renewed buyer demand.
For those looking to enter the market or expand their portfolio, the real opportunity often lies in understanding these shifts before they become obvious to everyone else.
Final Thoughts
Data like this offers a valuable snapshot of how buyer demand is currently moving across Melbourne.
However, interpreting that information correctly requires looking beyond the surface and understanding the broader forces shaping the market.
Every property decision should be backed by a clear strategy — one that considers location fundamentals, long-term growth drivers, and financial structure.
Because in property, the difference between an average purchase and a strategic one often comes down to seeing what the broader market hasn’t noticed yet.
Before making your next property move, book a no-obligation 30-minute Property Strategy Session to assess your position and uncover the opportunities most buyers are missing.
show less